A Chart Is Never 100% Accurate
Book Extract
In my opinion Admiralty charts are still the best, most accurate and most reliable charts available, but even they are, less than 100% accurate – and as a mariner you need to understand how and when to make allowances for these.
Many charts contain areas of old surveys because more modern data is just not available. But there are other reasons to question the accuracy of information that you are getting from your chart: the seabed may have shifted since the most recent survey; the chart may not be up to date; and you may from time to time experience tidal surges caused by strong winds and atmospheric pressure variations, which have the power to change the depth of water dramatically. There are also places where the seabed is just too mobile – with strong tides and a soft seabed – and the hydrographer simply does not bother charting the area at all – and that area of the chart is left white.
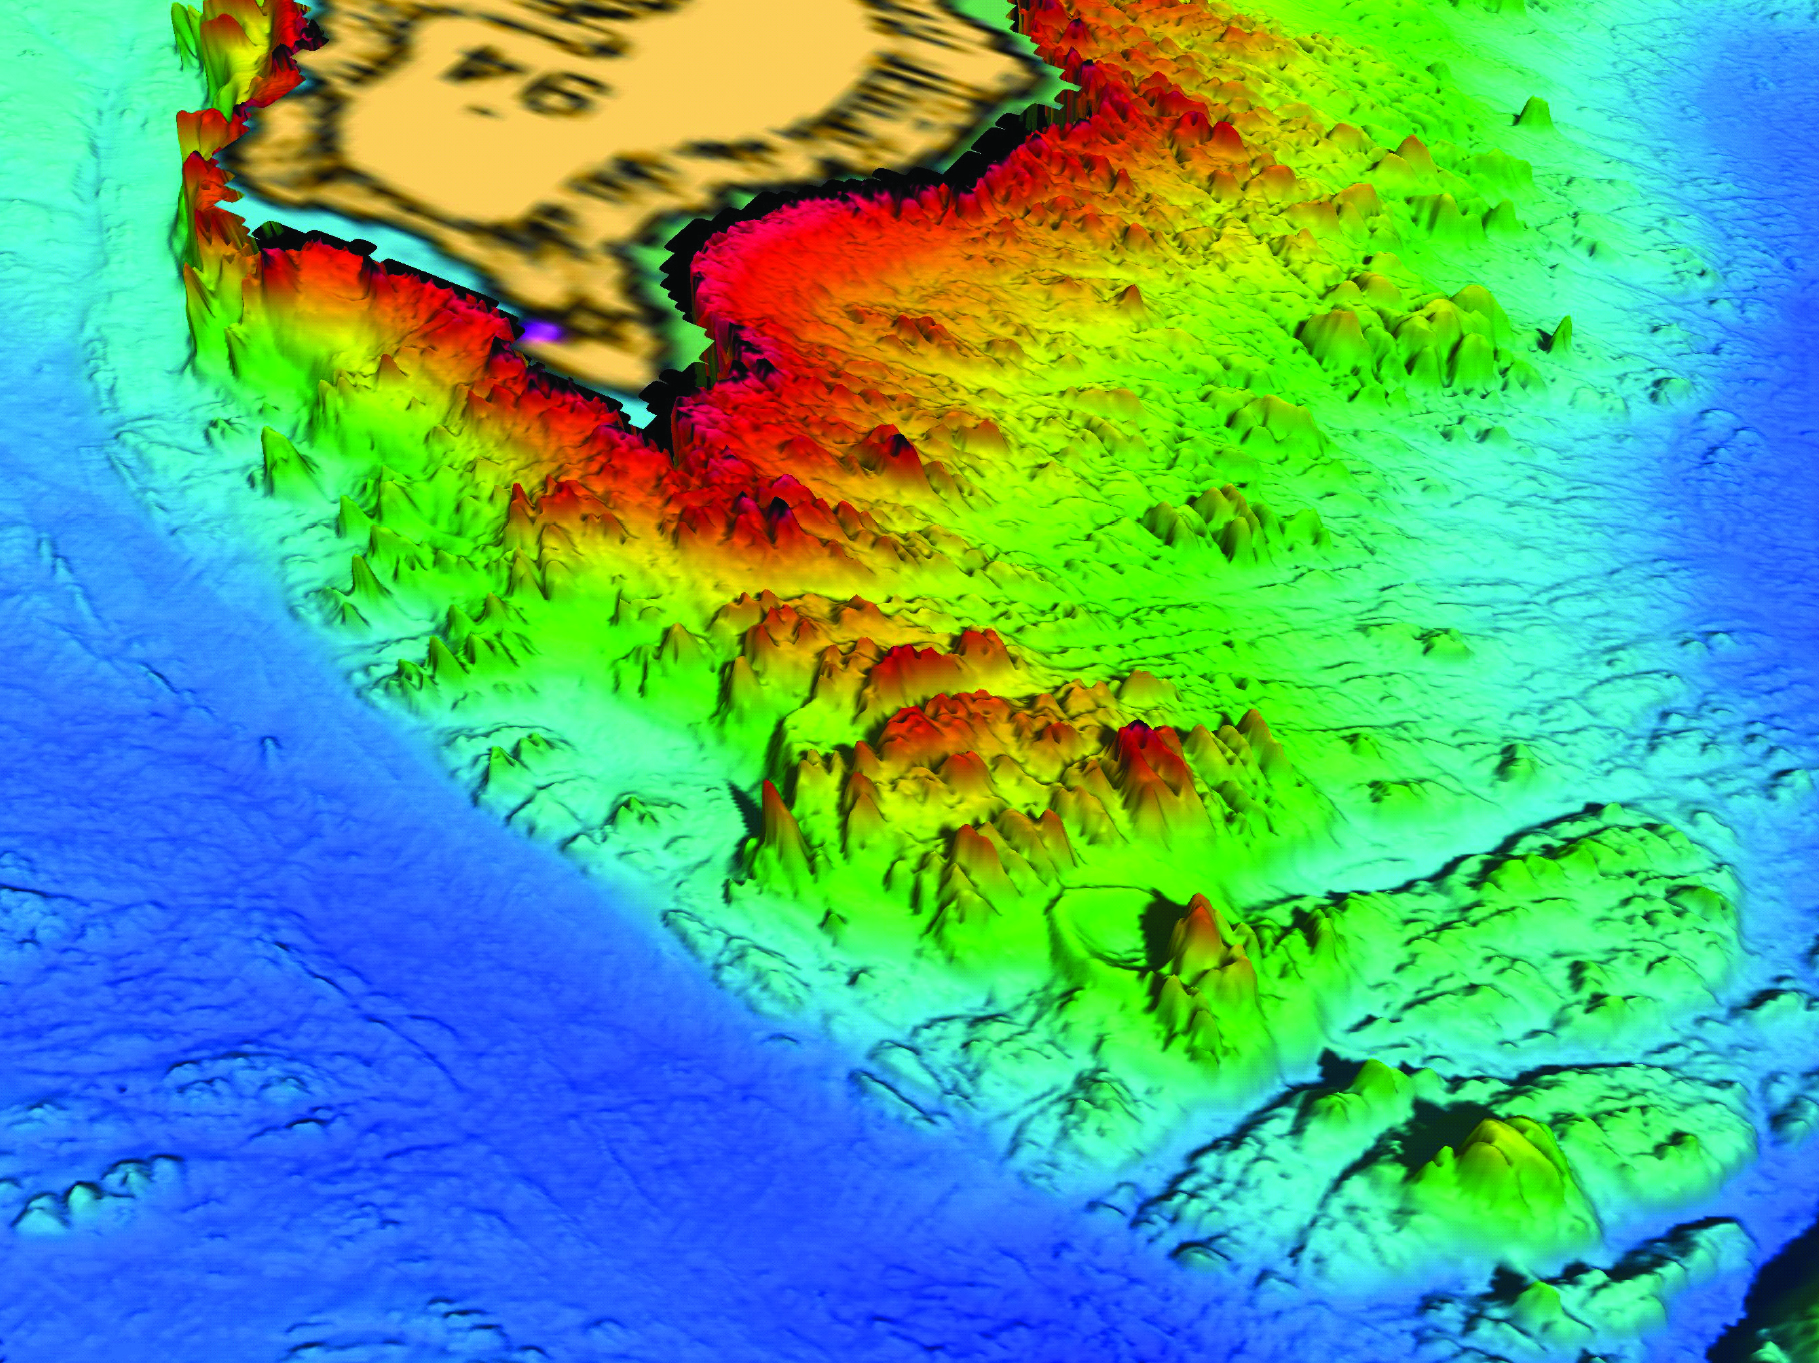
A complex bit of seabed
The chart compiler generally tends to err on the side of caution to give you and me that extra margin of safety to keep us from hitting the bottom, but even so, it pays to treat the information very carefully.
On 7 August 1992, the QE2 grounded on a shoal off the coast of Martha’s Vineyard on the eastern seaboard of the United States. Her draught at the time was 32 ft 4 in, the height of tide was about 1 ft 6 in, and the charted depth of water at the point where she grounded was 39 ft. By straightforward calculations she would have had about 8 ft of water under her keel. At the time she grounded, she was travelling at a speed of 25 knots. It transpired that the most recent survey of the area had been conducted in 1939 using an echo sounder. A post-event side scan survey, however, showed that the shallowest depth of water in the area was 31 ft and that the depth of water at the precise point where she grounded was 33 ft below Chart Datum, 6 ft less than the charted depth. It is likely that this patch of shallow water had quite simply fallen into one of the gaps left by the earlier echo sounder survey. A ship moving fast in any shallow water is certain to squat a foot or so . . . and suddenly, in the blink of an eye, you have reduced a confidently predicted clearance of 8 ft under the keel into an agonising incident with an awful lot of paperwork to fill in.
As a mariner, you need to know how to look at a chart in order to assess the risks and inaccuracies that it contains, so that you use it intelligently, recognising its limitations and identifying where you have to navigate with more caution. The information is often right there on the chart, paper or digital. It’s just a matter of knowing where to look, how to interpret the information and how much of a margin of error to apply.
© Not to be reproduced without written permission from Fernhurst Books Limited.
Understanding A Nautical Chart is written by Paul Boissier. Paul is a professional navigator and has spent much of his professional career working on the sea, or in support of the people who go to sea. He has commanded and navigated ships and submarines in many parts of the world, as well as spending a lot of time afloat in yachts. Paul also spent 10 years as Chief Executive of the Royal National Lifeboat Institution. He loves the sea and has had a lifelong fascination with charts and navigation.